At Maxio, we’ve worked with thousands of B2B SaaS operators who already have robust finance and accounting teams and sophisticated FinOps tech stacks, yet they still struggle to tie out bookings vs. billings vs. revenue vs. SaaS metrics.
There are a few factors that contribute to this:
- Fragmented order-to-cash process: Companies may have best-in-class tools, but if they’re managing bookings, billings, revenue, and SaaS metrics in different systems, they’re likely still doing manual reconciliations in spreadsheets.
- People are singing from different sheets of music: Because there is no governing body that dictates the way SaaS metrics are calculated, different stakeholders will have different opinions about what to include or exclude in vital metrics like ARR and NRR.
- The tools in their tech stack weren’t built for SaaS metrics: While there has been a lot of growth in B2B finance and accounting tech in recent years, most vendors didn’t start out with SaaS metrics for B2B in mind, meaning their metrics offerings are a mile wide and an inch deep.
What doesn’t work
We’ve been around for 14 years and have helped our customers raise $100B in funding, so we’ve seen every approach there is to solve the SaaS metrics problem. Here are a few things that DON’T work:
Better spreadsheets
There’s no amount of color coding and access controls that will derisk managing SaaS metrics in spreadsheets entirely. Add on top of that the inherent risk of formula errors (which let’s face it—even the most experienced Excel wizards make them) and you’ll very quickly find yourself in treacherous waters.
The reality is, there’s no governing body that regulates how SaaS metrics are calculated like there is with GAAP revenue, so a lot of it is up to interpretation.
Force-fitting an ERP
As companies scale, implementing an ERP may seem like the best way to eliminate the scale-up bottleneck. But ERPs aren’t silver bullets. SaaS companies in particular usually explore ERPs when they hit limitations with their GL, but then get cajoled into buying other modules, like billing and SaaS metrics in addition to the core GL.
Unfortunately, most ERPs were originally built for manufacturing companies. They were not made to handle the unique complexities of SaaS billing and the depth and breadth of SaaS metric reporting, leaving users frustrated when they need to appease investors, instill confidence in potential acquirers, or simply gain the level of operational insight needed to run the business day to day.
Hiring an analytics wiz to custom-build something in a BI tool
After the above methods have failed, we often see companies take the approach of hiring a senior analytics/BI person to come in and custom-build something in their BI tool of choice in order to get the dashboards and drill down views they need.
While this isn’t a terrible approach, it can be a time suck. It may take a BI person a year to build the SaaS-specific views the business needs, and that’s valuable time they could be spending analyzing the data and making strategic recommendations about the business.
Is it all doom and gloom? No! There’s a movement of SaaS winners who’ve overcome the SaaS metrics scale-up bottleneck.
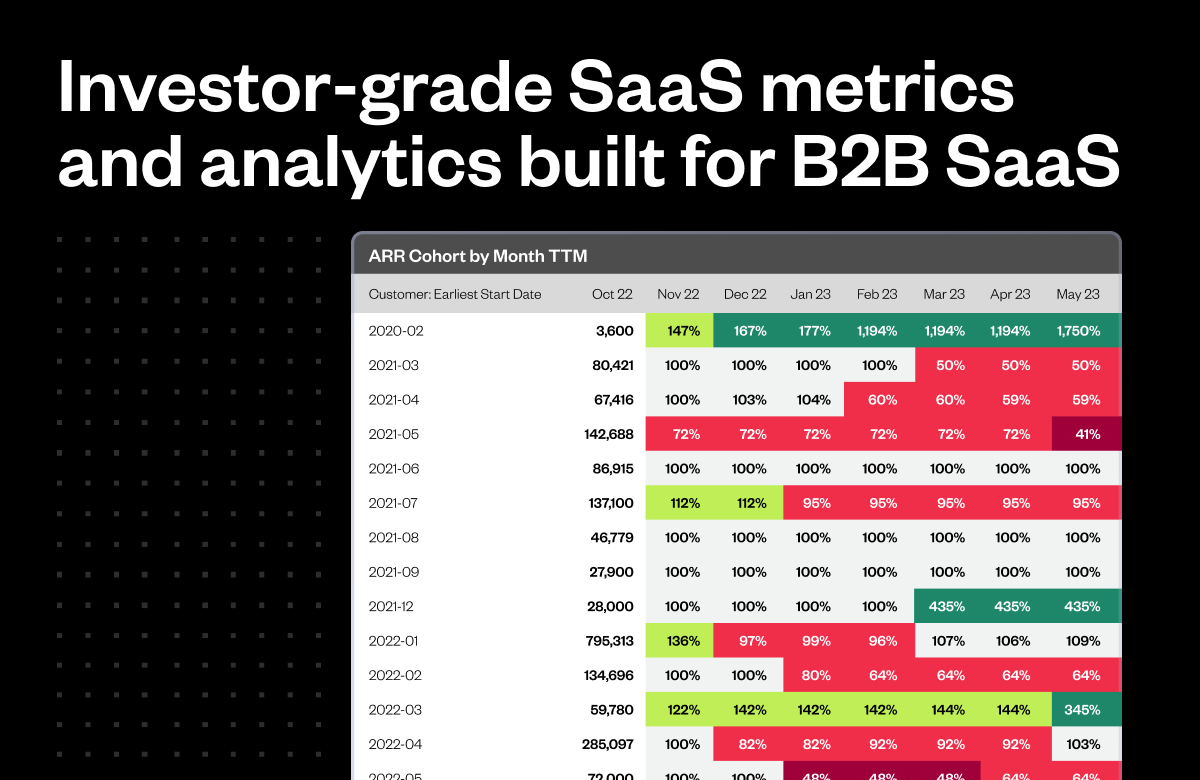
Introducing Maxio Metrics: investor-grade SaaS metrics and analytics built for B2B SaaS
SaaS metrics are part of Maxio’s core DNA. Our reports were forged from the fire of thousands of funding rounds, allowing our customers to raise over $100B in funding over the years. From there, the product expanded to include billing, collections, and revenue recognition. Today, SaaS metrics are a core part of the Maxio platform, and most customers are using our full set of capabilities.
However, we sometimes run into larger companies who are already managing billing somewhere else, like an ERP system, but they still have a gap when it comes to air-tight metrics.
That’s where our metrics reporting package, Maxio Metrics, comes in. Maxio Metrics allows our customers to get plug-and-play access to SaaS metrics, all while using their existing billing software or ERP as the source of truth.
– Kevin Sonsky, SaaS Metrics Consultant and former Citrix Executive
A few examples of reports you get with Maxio Metrics include:
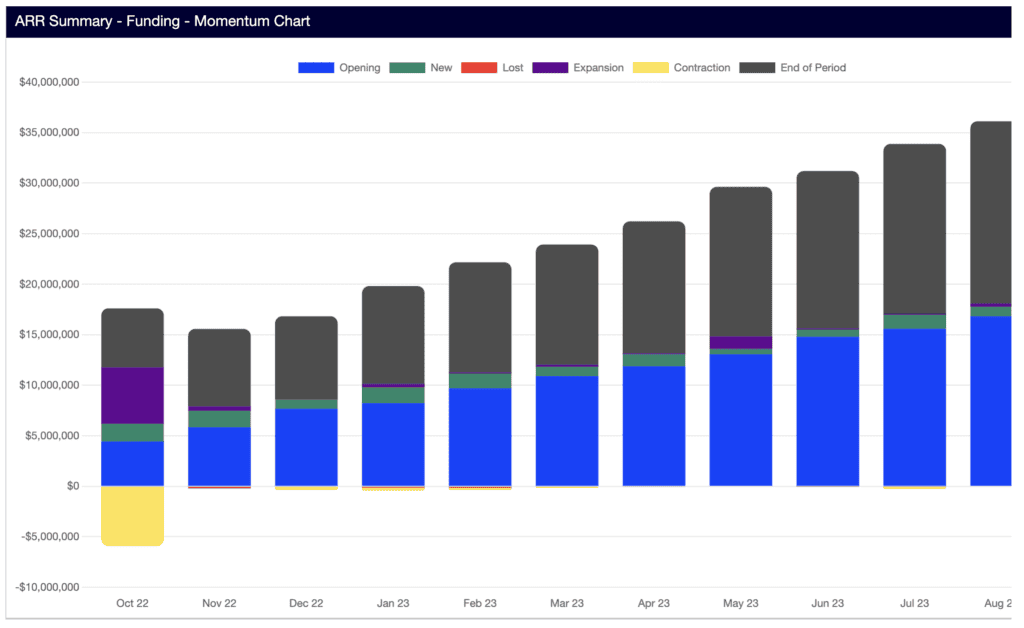
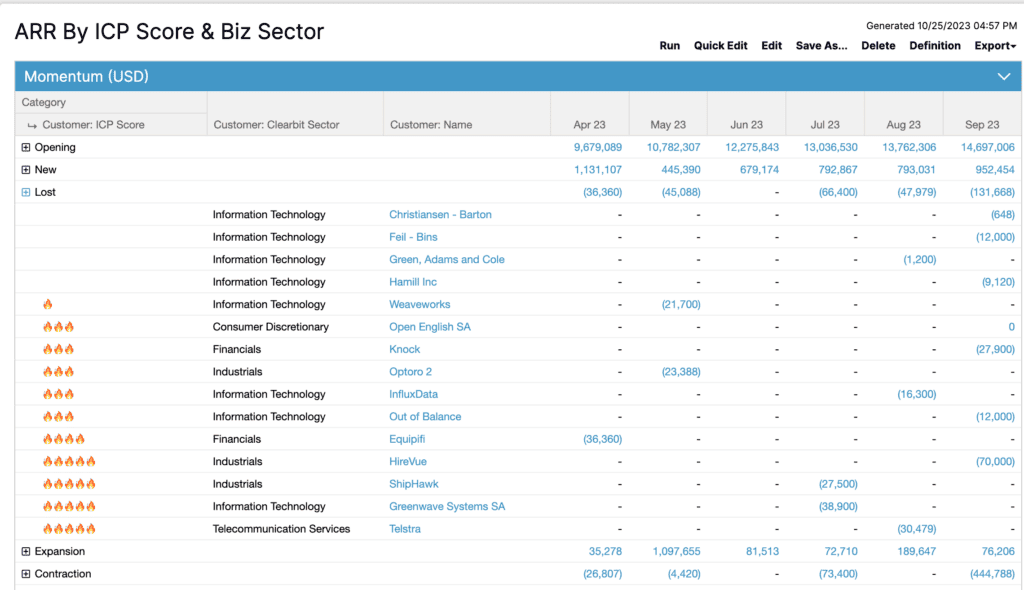
👉 Momentum Report (snowball view)
Maxio automatically categorizes your ARR into New, Expansion, Contraction and Churn. Categorize your ARR the same way every period for accurate and consistent metrics reporting. Compare this to the old way, where metrics data is inputted and categorized by error-ridden spreadsheets and reconciled by a dedicated, full-time employee and the ROI starts to prove itself.
👉 ARR/MRR
One of the challenges of a sales-led model is parsing out the difference between bookings or “committed” ARR and “live” ARR from customers who are up and running on your platform.
Maxio distinguishes between the unique use cases B2B SaaS companies experience, and can handle other complex use cases such as:
- Delays between the booking date and actual subscription start date
- Mid-term contract changes
- Early renewal upgrades
- Mid-month start dates
- and more

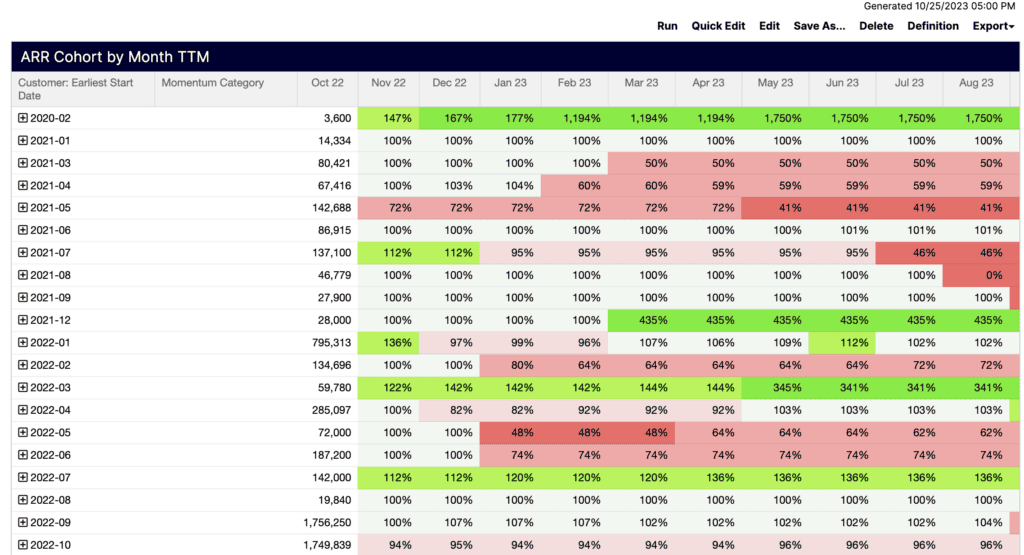
👉 Cohort Analysis
Want to dig into performance metrics by start date, industry vertical, salesperson, or something else? Maxio enables you to do in-depth cohort analysis with a few clicks of a button.
👉 Unlimited custom objects
Bring in custom objects from your CRM or GL to slice and dice data by the parameters that are relevant to your business. Or, leverage our free attribution data from Clearbit to populate data like Customer Location, Industry, Size, etc.
Ready to level up your SaaS metric reporting?
Maxio serves over 2,000 B2B customers, annually supporting over $14 billion SaaS billings. Over our 14 years in the business, our customers have raised over $100 billion in funding. We’re trusted by top-tier investors, like Battery Ventures, Insight Partners, and Francisco Partners.
Let us show you how to get investor-grade SaaS metrics and analytics at the click of a button.
Get a demo
Explore the #1 billing and finance platform for B2B SaaS.
FAQ
Question: Can we bring in historical data?
Answer: Absolutely. In most cases, customers bring in 1-2 years worth of historical data, but we can discuss this further in the sales process.
Question: How long does it take to implement?
Answer: This offering is by far our quickest implementation. In some cases we automatically ingest all of your historical data, and the implementation can be done in a few days. In other cases we upload historical data via a .csv file or API. This approach varies from a timing perspective. A rough estimate would be 2-4 weeks.
Question: What’s the best “source of truth” data?
Answer: We typically recommend customers use their billing/payments or GL because these sources paint a more accurate picture of the ongoing financial relationship with the customer, but we do occasionally have customers elect to use their CRM as the source of truth.

