2023 Maxio Institute Report
Consumption companies continue to see raising growth rates into 2024
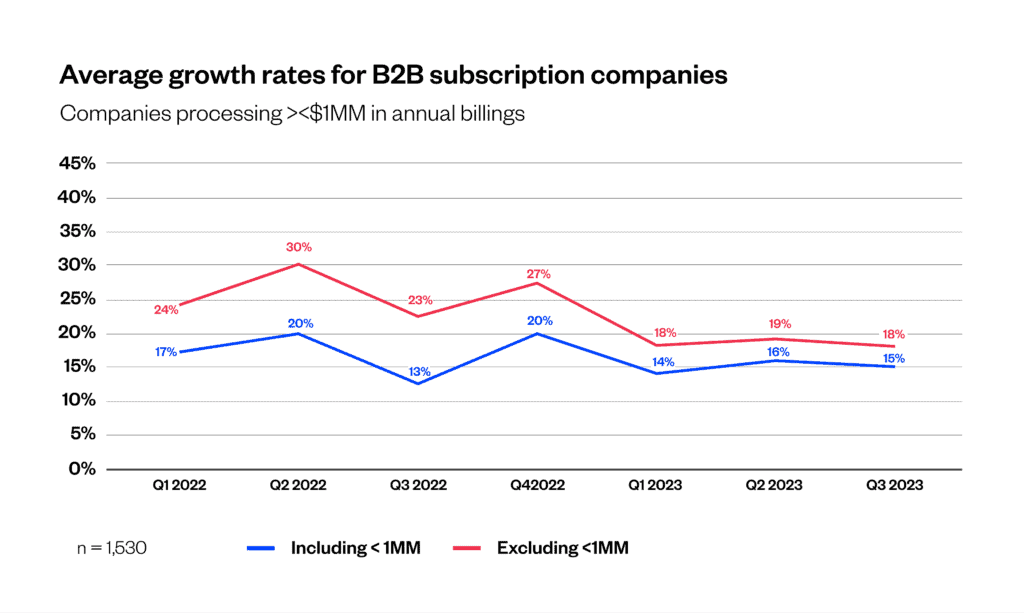
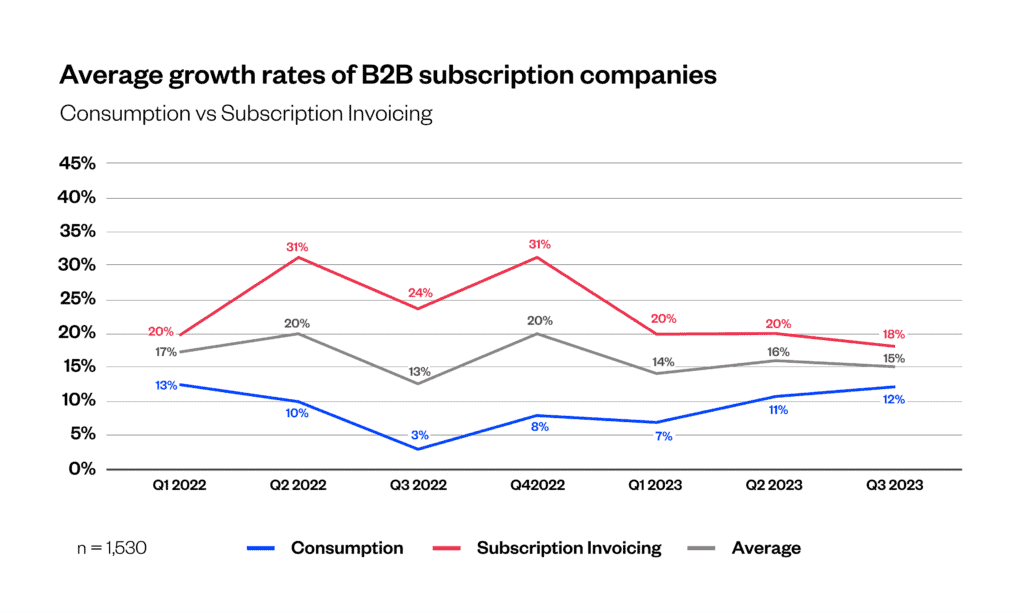
In our 1H 2023 report, we observed an encouraging increase in the annualized growth rates for B2B subscription businesses in Q2 vs. Q1 2023. As a whole, we’ve observed a steadying of growth rates in Q3 with average annualized growth rates for subscription businesses processing between $0 to $100MM averaging 15%, a 2% increase from the same period in Q3 2022.
As we predicted in our 1H report, invoicing oriented businesses have not returned to the growth rates experienced in 2022 and declined 2% from Q1 2023. By contrast, consumption businesses have experienced two consecutive quarters of growth rising a total of 5% from Q1 2023.
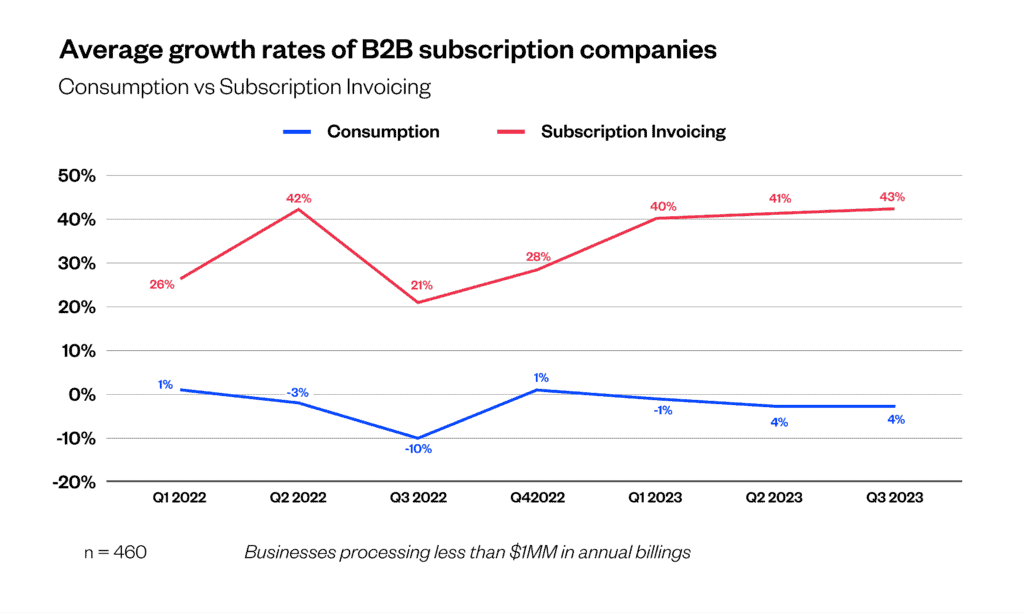
An area we highlighted in our 1H report, there is a stark contrast between companies processing less than $1MM in billings vs. those above $1MM. We suggested for a subscription business to break past $1MM in billings most will need a pricing package with a firm contract and predictable invoicing schedule. This trend remains true based on our analysis of companies processing <$1MM in billings. Annualized growth rates for invoicing businesses under $1MM continue to outpace their consumption oriented counterparts by nearly 40%.
Once you pass $1MM in annualized billings, you may need to pause and ask, what is the right pricing model to get to the next phase of growth? Do you lean towards predictable revenue by signing customers up for 12+ month subscriptions with predictable invoicing schedules or embrace a consumption-oriented model? The answer lies in aligning pricing and packaging to the value your customers receive from your product; however, whatever you decide will have implications on your ability to respond to shifting headwinds or tailwinds in the broader market.
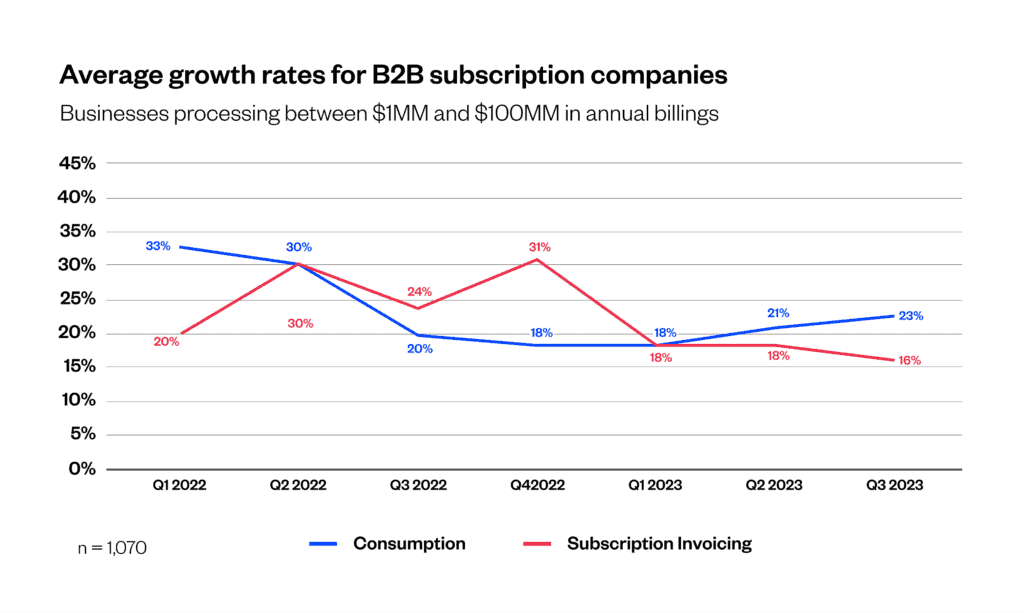
This dilemma is playing out in our analysis of businesses processing between $1 and $100MM in billings. As we highlighted in our 1H report, invoicing companies were less impacted by the market headwinds in 2022 as many contracts extend for 12+ months. The headwinds have finally caught up with invoicing businesses and growth remains 8% lower from Q3 2022.
The cloudy skies hovering over consumption businesses may finally be parting. These businesses have experienced two consecutive quarters of growth and are up 3% from Q3 2022. YTD, consumption businesses have increased 5% YTD vs. invoicing businesses who have experienced a 2% decline from the start of the year.
The positive movement in consumption growth rates may point to better days for invoicing businesses beginning as soon as Q4 2023.
Stay tuned for another update coming at the beginning of 2024. Until then, check out our 1H report below.
How we analyze our data
The Maxio Growth Index analyzes anonymized year-over-year (YoY) customer billing data from Maxio, a billing and financial operations platform for B2B SaaS, which currently processes over $14B in billing and invoicing data annually. Maxio has over 2,300 customers, most of which are VC- or PE-backed software-as-a-service (SaaS) companies with revenue between $0MM and $100M.
We continue to refine our methodology for how we analyze our data. Following the release of our inaugural and 1H 2023 reports, we’ve made the following refinements to our filtering criteria for analyses:
- Reduced our quarterly flux threshold to remove companies who have positive or negative growth rates in excess of 100% (previously 200%).
- Added refined filters to remove companies in process of migrating on or off of the Maxio platform.
- Increased the threshold for what constitutes an “active” customer from greater than $0 to greater than $50k in total billings a given quarter.
How we calculate YoY growth rates
We take growth in TTM billings, or revenue, at the end of a quarter (e.g. 6/30/23) vs the prior quarter (e.g. 3/31/23) and multiply by 4 to calculate our annualized growth rate.
((Q2 revenue – Q1 revenue) – 1) x 4 = Annualized Growth Rate
How we determine whether to use billings or revenue
Consumption based companies: TTM billings
Consumption-based companies typically have monthly-based measurement and billing. Adding the sum of all invoices sent over the last 12 months, most times, is the best way to estimate the annualized revenue of one of these companies.
Subscription invoicing companies: TTM revenue
Subscription invoicing companies often have pre-negotiated terms (often 1–3 years) and billing schedules. Using revenue instead of billings allows us to remove significant fluctuations in the underlying data which might be caused by an annual invoice or subscription paid up front.
How we filter out anomalies
We remove customers who:
- Have quarterly growth rates greater than 100% or less than -100%, or
- Were inactive at the beginning or end of a quarter (we consider a customer active if they have at least $50k in billings or revenue in a quarter), or
- Were in the process of ramping volume onto, or off of, the Maxio platform
The State of SaaS Growth 2023
We’ve analyzed the billing data of over 2,100 B2B SaaS companies between 2022 and 2023 and have presented key insights, including:
- Growth rates of businesses based on billing type
- Where some of the fastest growing companies are located
- The bar for raising your successive round of investment.